


 Breaks Key Resistance In Second Parabolic Rally, Targets $3.")
Main highlights:
- Virtual won 89.89% in May, currently traded at $ 2.39 with MCAP of $ 1.56 billion
- Futures Open interest rose from $ 35 million in April to $ 239 million by 9 May; Now for $ 299 million.
- Daily Trade Volume became $ 2.14 billion on May 9, currently at $ 1.38 billion.
- Momentum remains strong. Trend is bullish, but traders have to look for signs of exhaustion near resistance.
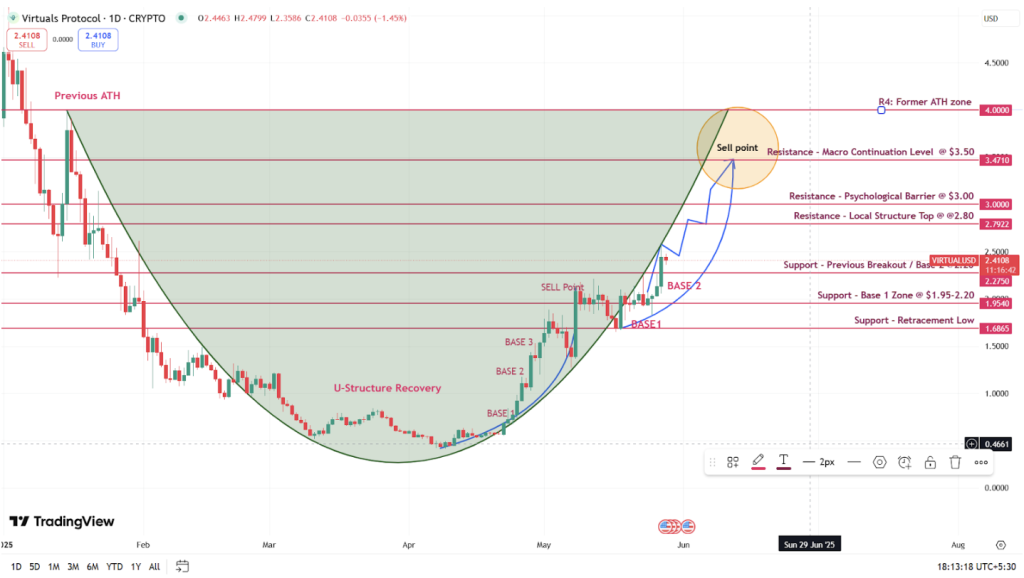
- Price has surpassed the BreakOut zone of $ 2.20, indicating a strong continuation setup.
Virtual protocol (virtually) regains the momentum and breaks above $ 2.20 in a renewed parabolic rally, where traders express $ 3 as a technical way, while the growth of ecosystem use remains moderated.
Virtual/USD -Price analysis: second parabolic rally in progress
The volume peaked at $ 2.14 billion on May 9 and then dropped to $ 1.11 billion on 24 May. From 28 May it returned to $ 1.38 billion, with renewed interest and sufficient liquidity for continuation.
Growth catalysts who feed the rally
- Genesis Launchpad (April 17): Introduced a new tokend distribution mechanism, activating new user interest and participation.
- Binance.us Listing (April 29): Significantly extensive trade access and improved liquidity through a top exchange.
- Narrative momentum: Branding As an AI agent forecast protocol, speculative attention has attracted trend-oriented traders.
- Influencer -involvement: Prominent crypto analysts who emphasize the Virtformance of Virtual against ETH and Sol have increased its visibility. Virtual price forecast: can bulls reach $ 3.00?
Virtual price forecast: Can bulls reach $ 3?
Virtual remains in a confirmed parabolic rally, supported by high open interest and a strong volume. If the price applies more than $ 2.20 and $ 2.80 with strength breaks, the path to $ 3.00 will probably be. The current U-shaped recovery reflects a continuation of the macro trend.
Short-term forecast (29 May-5 June):
- Possible withdrawal in the short term $ 2.35 – $ 2.40.
- A revision of $ 2.20 Stays healthy within the arch structure.
- Breakout $ 2.80 can virtually $ 3.00.
Outlook in the medium term (June 5, 14 June):
- If $ 3.00 breaks with volume, the next resistance is $ 3.50.
- Further, $ 3.87– $ 4.00 Will be the macro breakout.
The parabolic structure remains valid as long as $ 2.20 Holds. Failure below this level can break the curve.